


Why playoff goaltending can swing your NHL bets
When the regular season ends and the playoffs start, the margin for error shrinks. You need to understand how goaltenders influence outcomes differently in the postseason so you can place smarter wagers. In the playoffs, single saves and short hot streaks can decide series, so betting profits often come from spotting sustainable performance indicators rather than reacting to noise. This section explains the playoff context and why you should prioritize specific goalie metrics over headline stats.
Postseason context that changes goalie value
- Smaller sample sizes: Series are often decided in a handful of games, so outlier performances have outsized effects. You should treat each game’s numbers with caution and look for corroborating evidence across several metrics.
- Tactical adjustments: Coaches tighten systems and exploit mismatches. That can reduce shot volume but increase shot quality — meaning a goalie’s high-danger shot handling becomes more important than overall save percentage.
- Fatigue and workload spikes: Physical and mental fatigue accumulate differently in the playoffs. A starter who carried heavy regular-season minutes may show wear, while a hot backup can swing a series.
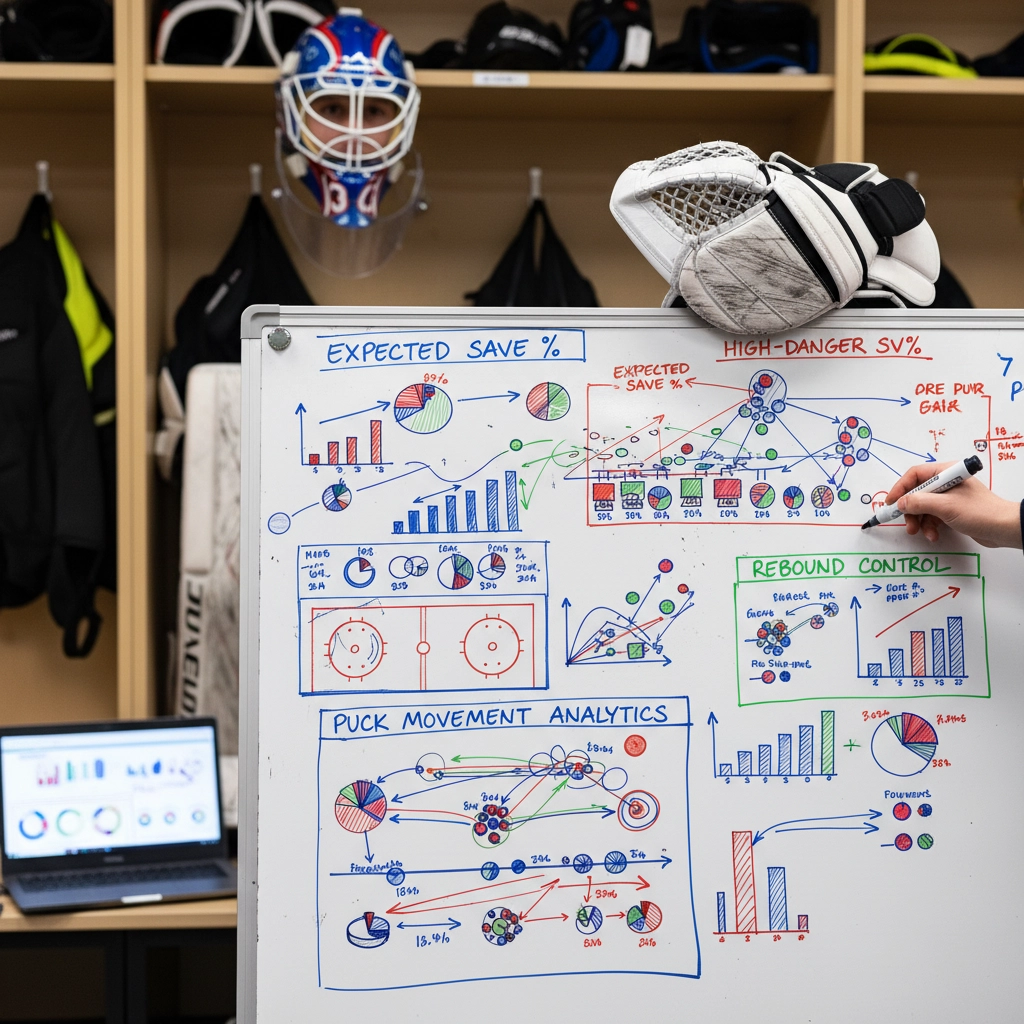
Early metrics to prioritize when sizing playoff bets
Not all goalie stats are equally predictive in the postseason. You should filter out vanity metrics and focus on indicators that measure true impact and sustainability. Below are the primary metrics you’ll want to examine before placing bets, with practical notes on how to interpret each for playoff scenarios.
Key performance indicators and what they tell you
- High-Danger Save Percentage (HDSV%): This isolates saves on the most dangerous chances. In the playoffs, teams generate fewer but better chances; a goalie who can consistently stop those is extremely valuable.
- Goals Saved Above Expected (GSAx): GSAx measures how many goals a goalie prevents relative to the quality of shots faced. Positive GSAx across recent games suggests repeatable skill rather than luck.
- Rebound control and second-chance prevention: Look for metrics or video evidence showing a goalie limits second opportunities. Teams that pressure rebounds more will benefit if the goalie can smother or redirect pucks efficiently.
- Workload & rest patterns: Track games played, minutes, and time between starts. A goalie with back-to-back heavy workloads entering a series may underperform versus a well-rested opponent.
- Recent form vs. career playoff history: Short-term hot stretches can be misleading; give extra weight to prior playoff performance and how a goalie handled playoff-specific pressure.
These metrics give you a framework to compare goaltenders beyond basic save percentage and goals against average. In the next section, you’ll get a deeper, game-by-game methodology to apply these stats to moneyline, puck line, and live in-play bets.
Game-by-game methodology to evaluate playoff goaltenders
Turn the shortlist of metrics into a repeatable pre-game routine so your bets aren’t driven by gut or recency bias. Treat each start as a checklist you can run in under five minutes:
- Quick stat snapshot: Pull HDSV% and GSAx for the last 10 games and season-to-date. Note whether HDSV% is materially higher or lower than the goalie’s baseline.
- Contextual filters: Check rest (days since last start), cumulative minutes in last 7–14 days, and whether the goalie has faced top-line competition recently. Heavy recent workloads downgrade expectation.
- Opponent profile: Compare the upcoming opponent’s shot quality and rebound-heavy tendencies. Teams that live off scrambles punish goalies who allow juicy rebounds.
- Video spot-check: Watch the last 1–2 starts for rebound control and lateral mobility on cross-crease chances. Metrics flag risk, but video confirms mechanism.
- Stability signals: Look for consistency across metrics — a high HDSV% supported by positive GSAx and low rebound rates is a stronger indicator than any one stat alone.
Combine these into a simple grading system (green/yellow/red) rather than trying to produce a single perfect number. For example, two or more green indicators = tilt toward backing the goalie on the moneyline; two or more red = avoid goalie-dependent bets and consider the opponent instead.
Applying goalie metrics to moneyline, puck-line, and live bets
Different wagers reward different aspects of goalie performance. Match the metric to the bet type before you put money down.
- Moneyline: Prioritize sustainable skill indicators (HDSV% and multi-game GSAx). Moneyline value comes when market underprices a goalie whose recent form and rest advantage are both favorable.
- Puck-line (-1.5): This requires not only a quality goalie but also a strong offense. If a goalie shows elite HDSV% and the opponent produces high shot volume but low high-danger share, the puck-line becomes viable; avoid if rebound control is poor.
- Live/in-play: Use early-game high-danger shot tracking as your guide. If a goalie shuts down high-quality chances in the first period and looks sharp on second-chance prevention, in-play moneyline or under bets often offer quick edges. Conversely, an early soft goal with rebound trouble is a sell signal.
Always size stakes relative to how goalie-driven the game is. A matchup where both teams excel defensively but one goalie has a clear HDSV edge warrants larger wagers than a wide-open, offense-driven game.
Situational nuances that create market edges
Small, non-obvious factors frequently swing goalie performance and market pricing:
- Starter changes: Backups who are hot and rested often climb into markets slower than they should. Monitor practice reports and coach comments; early market underreaction is an opportunity.
- Travel and arena quirks: Long road trips, timezone swings, and hard-ice/soft-ice differences affect rebound behavior and puck tracking. Adjust expectations for goalies who rely on angles and depth perception.
- Coaching tendencies: Defensive-minded systems can hide mediocre goalies by limiting high-danger looks; aggressive systems can expose even elite netminders. Account for opponent game plan.
- Public bias and overreaction: Markets overvalue single-game shutouts or panic after a bad outing. Use your graded metrics to exploit these overreactions rather than following them.
Combine these situational reads with your game-by-game grades to find bets where implied odds diverge from your informed projection. That consistent edge — not perfect forecasting — is what moves a bettor from hobbyist to profitable.

Putting the checklist to work
Treat the routines and grading system in this article as a disciplined workflow, not a prediction machine. Run the five-minute pre-game checklist before committing capital, size bets according to how goalie-driven the matchup is, and log outcomes so your model and instincts improve over time. Be patient with small samples: the market often overreacts to single-game events, which creates the edges you want to exploit. For reliable data feeds to power your checklist, consult established advanced-stats resources such as Natural Stat Trick.
Frequently Asked Questions
Which goalie metric should I weigh most heavily for playoff moneyline bets?
Prioritize sustained indicators of skill rather than single-game numbers. High-Danger Save Percentage (HDSV%) and multi-game Goals Saved Above Expected (GSAx) are the most useful for moneyline decisions because they reflect a goalie’s ability to stop dangerous chances over time. Combine those with rest/workload checks to confirm the start is likely to maintain form.
How do I account for workload and rest when evaluating a starter?
Look at days since last start, cumulative minutes over the past 7–14 days, and recent back-to-back usage. Heavy recent workloads lower short-term expectation; a well-rested backup who’s been playing fewer minutes but showing strong HDSV% and GSAx can be undervalued. Adjust bet size downward if the starter shows fatigue signals or has played an unusually large share of team minutes.
Are playoff shutouts and hot streaks reliable signals for betting?
No — single shutouts and very short hot streaks are often noise in playoffs’ small samples. They can move public markets, but you should look for corroborating metrics (HDSV%, positive GSAx, low rebound rates) and video evidence of sustainable skill before increasing exposure. Treat lone standout games as alerts for deeper checks, not immediate reasons to bet big.