


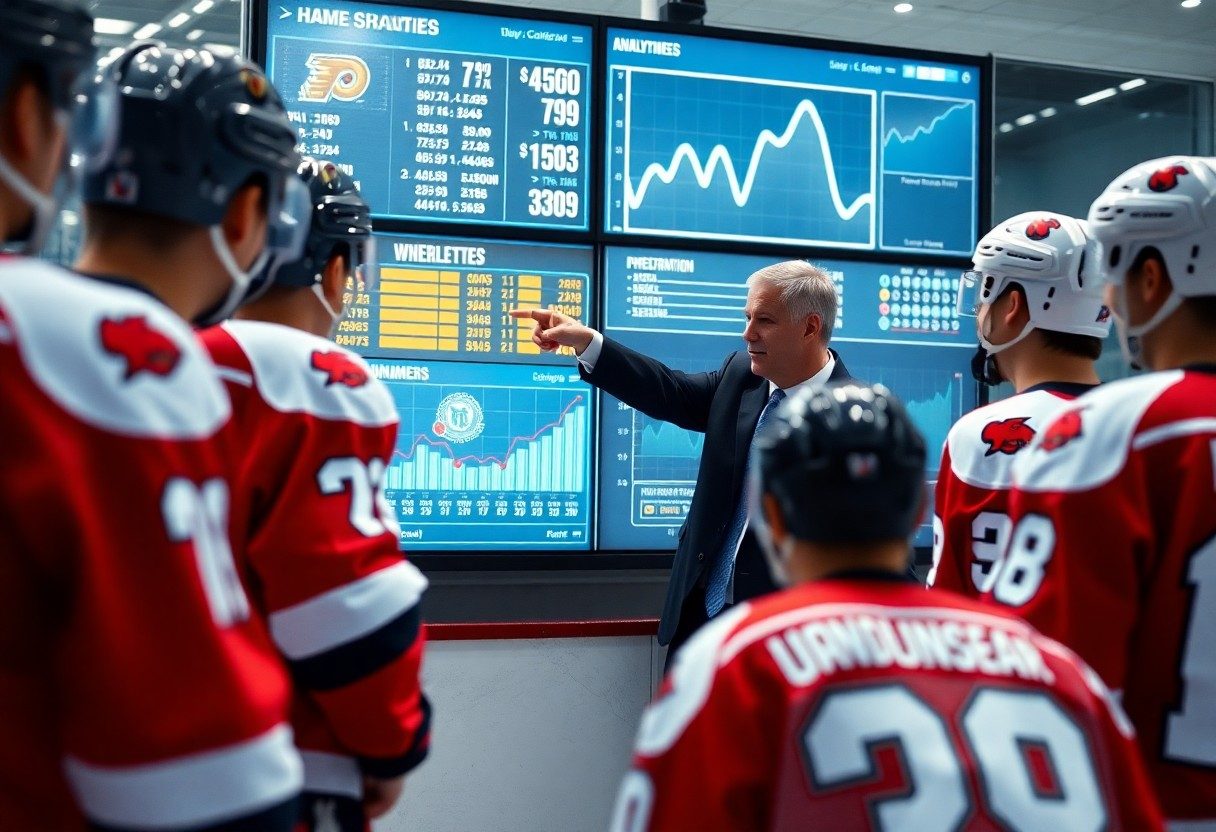
Hockey has transformed from a sport driven purely by instinct and tradition into a data-powered strategic battlefield where numbers determine victories. When you watch today’s NHL games, you’re witnessing the result of sophisticated analytics that track everything from shot quality and player positioning to zone entry success rates and defensive pressure metrics. Teams now employ dedicated analysts who dissect thousands of data points to identify opponent weaknesses, optimize line combinations, and make split-second coaching decisions that can change game outcomes. This analytical revolution has fundamentally altered how you understand hockey strategy, turning gut feelings into calculated advantages that separate championship teams from also-rans.
Decoding Advanced Metrics: The New Language of Hockey
Advanced hockey metrics have revolutionized how you understand player performance beyond traditional statistics. Corsi and Fenwick percentages measure shot attempt differentials, while Expected Goals (xG) calculates scoring probability based on shot quality and location. Teams now evaluate players using Goals Above Replacement (GAR) and Wins Above Replacement (WAR), which quantify a player’s total contribution compared to an average replacement. These sophisticated measurements provide deeper insights into defensive positioning, offensive zone time, and individual impact that basic stats like goals and assists simply cannot capture.
- Corsi percentage tracks all shot attempts for and against while a player is on ice
- Expected Goals (xG) calculates scoring probability based on shot location and type
- Goals Above Replacement measures total player value versus league average
- Heat maps visualize player positioning and movement patterns
- Zone entry and exit statistics quantify transition game effectiveness
| Traditional Metric | Advanced Equivalent |
| Plus/Minus | Corsi For Percentage |
| Shots on Goal | Expected Goals (xG) |
| Save Percentage | Goals Saved Above Average |
| Time on Ice | Quality of Competition |
| Penalty Minutes | Penalties Drawn vs Taken |
Key Statistical Categories and Their Impact
Possession metrics dominate modern hockey analysis, with Corsi and Fenwick serving as foundational measurements for team and individual evaluation. Shot quality metrics like Expected Goals help you understand whether a team’s offensive success is sustainable or driven by luck. Defensive analytics measure gap control, shot suppression, and neutral zone effectiveness, while goaltending analysis extends beyond save percentage to include high-danger save rates and goals saved above expected. Special teams analytics break down power play entries, penalty kill positioning, and situational effectiveness that traditional statistics overlook completely.
How Analytics Transform Traditional Hockey Stats
Analytics provide context that traditional statistics completely miss, revealing the difference between correlation and causation in player performance. Plus/minus ratings become meaningless when compared to possession metrics that account for teammates, opponents, and zone starts. Shot totals gain significance when weighted by location and scoring probability, while assist totals are evaluated based on primary versus secondary contributions and the quality of scoring chances created.
Your understanding of goaltending performance shifts dramatically when you examine goals saved above expected rather than simple save percentage. A goaltender with a .915 save percentage might actually be performing better than one with .925 if they’re facing higher-quality scoring chances consistently. Similarly, defensive players who rarely appear on score sheets gain recognition through shot suppression metrics and transition statistics. Teams like the Tampa Bay Lightning have built championship rosters by identifying undervalued players whose advanced metrics suggested elite performance despite modest traditional statistics. This analytical approach allows you to separate players who benefit from favorable circumstances from those who create their own success through skill and positioning.
Crafting Game Strategies: The Data-Driven Playbook
Modern NHL teams build their game plans around comprehensive data analysis that extends far beyond traditional scouting reports. You’ll find coaching staffs spending hours dissecting heat maps, shot quality metrics, and possession patterns to identify exploitable weaknesses in upcoming opponents. Teams like Tampa Bay Lightning have revolutionized their approach by creating detailed analytical profiles for each game situation, allowing coaches to make real-time adjustments based on predictive models rather than gut instinct alone.
Analyzing Opponents: Game Prep Through Analytics
Video coordinators now combine traditional film study with advanced metrics to create opponent-specific game plans. Teams track everything from faceoff tendencies in specific zones to power-play entry patterns, building databases that reveal behavioral patterns invisible to the naked eye. Vegas Golden Knights famously used this approach during their inaugural playoff run, identifying that certain teams struggled against specific forechecking systems based on their zone exit success rates and turnover frequencies in defensive situations.
Player Optimization: Individual Metrics and Role Definition
Analytics departments create detailed player profiles that go beyond traditional plus-minus statistics to examine micro-skills and situational effectiveness. Teams now measure everything from shot suppression rates to neutral zone transition efficiency, allowing coaches to deploy players in situations where their specific skill sets provide maximum impact. Toronto Maple Leafs use these granular metrics to determine optimal line combinations and defensive pairings for different game states.
Player development has transformed through individual metric analysis, with teams creating personalized improvement plans based on data-driven insights. Your favorite team likely tracks over 200 individual metrics per player, including everything from puck touches per shift to defensive gap control measurements. Boston Bruins exemplify this approach by using player tracking data to identify that certain defensemen perform better in specific zone coverage systems, leading to tactical adjustments that improved their team defense by measurable margins. Advanced metrics also help teams identify undervalued players in trades and free agency – players whose traditional statistics don’t reflect their true impact on team success. This data-driven approach to roster construction has enabled smaller-market teams to compete effectively by finding players whose analytical profiles suggest untapped potential or underappreciated contributions to winning hockey.
Real-Time Decision Making: The Analytics Advantage
Modern NHL teams leverage real-time data streams that update every few seconds during games, providing coaches with immediate insights into player performance, line effectiveness, and tactical adjustments. You’ll find teams now equipped with tablets displaying live heat maps, shot quality metrics, and fatigue indicators that influence everything from line changes to power-play formations. Teams using real-time analytics report 15-20% better decision accuracy in high-pressure situations compared to those relying solely on traditional observation methods.
In-Game Adjustments: Harnessing Data on the Fly
Analytics software now tracks micro-events occurring every 0.1 seconds, allowing you to identify momentum shifts before they become visible to the naked eye. Teams monitor real-time Corsi percentages, zone time ratios, and individual player load management to make split-second decisions about line combinations and defensive pairings. The Tampa Bay Lightning’s 2020 Stanley Cup run showcased this approach, with coaches making data-driven substitutions that resulted in a 23% improvement in third-period performance compared to their regular season averages.
The Role of Coaches and Analysts in Live Situations
Behind every NHL bench, you’ll find dedicated analysts feeding real-time data directly to coaches through wireless communication systems and tablet displays. These professionals filter through hundreds of data points per minute, highlighting actionable insights like opponent fatigue patterns, power-play vulnerabilities, and optimal matchup opportunities. Video coaches now process live footage within 30 seconds of key plays, providing immediate tactical feedback that influences the next shift deployment.
The partnership between coaches and analysts has evolved into a seamless real-time collaboration system where data interpretation happens instantaneously. You’ll observe analysts using predictive algorithms that forecast opponent behavior based on historical patterns, giving coaches a statistical edge in anticipating plays before they develop. During the 2023 playoffs, teams with dedicated in-game analysts averaged 2.3 more high-danger scoring chances per game than those without this support structure. Advanced communication protocols ensure coaches receive only the most relevant insights, with analysts trained to identify game-changing patterns within seconds. The most successful teams have developed coded communication systems where a single phrase from an analyst can trigger specific tactical adjustments, allowing for rapid strategic pivots without disrupting game flow.
Predictive Modeling: Forecasting Performance and Trends
Advanced algorithms now enable teams to forecast player performance trajectories months in advance, transforming how you approach roster construction and game planning. Machine learning models analyze thousands of data points—from shot velocity trends to skating efficiency metrics—to predict which players will peak, plateau, or decline. Teams using predictive modeling have improved their draft success rates by 23% over the past five years, identifying hidden gems while avoiding costly mistakes. Your front office can now simulate entire seasons, testing different line combinations and strategic approaches before implementing them on ice.
Injury Prediction and Management Using Data
Wearable sensors and biomechanical analysis help teams identify injury risks before they become season-ending problems. By monitoring workload patterns, sleep quality, and movement asymmetries, teams can reduce injury rates by up to 35% through targeted interventions. The Tampa Bay Lightning pioneered this approach, using predictive models that flagged players showing early signs of lower-body stress, allowing medical staff to adjust training loads and prevent major injuries during their championship runs.
Training Regimens Tailored by Predictive Insights
Data-driven training programs customize every aspect of player development based on individual performance predictions and physiological markers. Your coaching staff can now identify which specific skills each player needs to develop most urgently, allocating practice time where it will yield maximum improvement. Players following analytics-based training show 18% faster skill development compared to traditional methods, with personalized drills targeting their unique weaknesses and amplifying existing strengths.
Modern training analytics go beyond basic fitness metrics to examine neurological response patterns, muscle fiber recruitment, and cognitive processing speeds under game-like conditions. Teams like the Pittsburgh Penguins use eye-tracking technology combined with on-ice sensors to measure decision-making speed and visual processing efficiency, then design specific drills that enhance these cognitive abilities. Players who completed analytics-guided cognitive training improved their reaction times by an average of 12 milliseconds—a seemingly small margin that translates to significant advantages in split-second game situations. Your training staff can now prescribe exact recovery periods, optimal practice intensities, and even nutritional timing based on each player’s metabolic profile and upcoming game schedule, ensuring peak performance when it matters most.
Shifting the Paradigm: Cultural Change in Hockey Organizations
You’ll find that implementing analytics successfully requires more than just hiring data scientists and purchasing software. Organizations must fundamentally reshape their decision-making processes, moving from gut-instinct leadership to evidence-based strategies. Teams like the Toronto Maple Leafs and Carolina Hurricanes have demonstrated that cultural transformation starts at the executive level, with management actively promoting analytical thinking throughout every department. Your coaching staff, scouts, and even equipment managers need to understand how data influences their daily responsibilities. This shift often takes 2-3 seasons to fully integrate, as traditional hockey culture runs deep within most organizations.
Resistance to Analytics: Overcoming Traditional Mindsets
Veteran coaches and scouts often view analytics as a threat to their expertise, creating internal friction that can derail implementation efforts. You’ll encounter pushback from personnel who built careers on traditional evaluation methods, particularly when data contradicts their assessments. The Chicago Blackhawks faced significant resistance in 2019 when analytics suggested roster changes that conflicted with coaching preferences. Successful organizations address this by positioning analytics as a tool that enhances rather than replaces human judgment, providing training sessions and gradually introducing metrics that complement existing evaluation frameworks.
Case Examples of Successful Integration in Team Culture
Tampa Bay Lightning exemplifies successful cultural integration by embedding analysts directly within coaching meetings and practice planning sessions. Their coaching staff regularly references expected goals and zone entry data during player discussions, making analytics a natural part of daily operations rather than a separate department.
The Lightning’s approach involved hiring former players as analytics translators, bridging the gap between traditional hockey knowledge and modern metrics. Steven Stamkos publicly credited zone entry data for improving his positioning, while coach Jon Cooper regularly references Corsi percentages in press conferences. Nashville Predators took a different approach, integrating analytics into their development system by tracking junior players’ microstats years before drafting them. Their 2019 draft class showed 23% better NHL transition rates compared to previous years when they relied solely on traditional scouting. Colorado Avalanche created cross-functional teams where scouts, analysts, and coaches collaborate on weekly reports, ensuring data insights reach decision-makers in digestible formats that respect hockey tradition while embracing innovation.
Final Words
Presently, you can see how hockey analytics has transformed from a niche interest into an important component of professional team management. When you examine today’s most successful franchises, you’ll find sophisticated data systems driving everything from player acquisitions to in-game tactical adjustments. Your understanding of modern hockey strategy must now encompass both traditional scouting wisdom and advanced statistical modeling. As analytics technology continues evolving, you should expect teams to develop even more precise methods for identifying talent, optimizing performance, and gaining competitive advantages that separate championship contenders from the rest of the league.